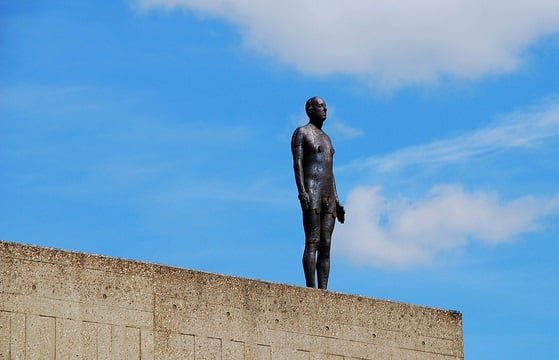
Hayward Gallery closure contributed to a fall in visitor numbers
Photo: www.traveljunction.com on VisualHunt.com / CC BY-SA
Arts Council reports collapse in London arts attendance
Arts Council England attributes the majority of the unprecedented 16.6 million fall to a drop in exhibition visitor numbers, but has declined to give details of how it arrived at these figures.
Arts Council England (ACE) has reported a huge fall of 16.6 million visits to its National Portfolio Organisations (NPOs) between 2015/16 and 2016/17.
The figures include a dramatic decline of 17m (28%) in attendance and visits at London’s NPOs, which was marginally offset by modest increases in some other parts of the country.
While the South West saw 2 million (28%) fewer attenders, and the Midlands lost 1.5 million (15%), attendance figures in the South East grew by over 3 million (51%), and 1 million (6%) more attended NPO activities in the North.
Crisis in exhibitions?
According to ACE’s 2017/18 Annual Report 91% of the unprecedented decline can be attributed to exhibitions. It specifically mentions “the temporary closure of a number of significant cultural buildings for capital work” and “a number of biennial events that took place in 2015/16 and not 2016/17.”
An ACE spokesperson told AP: “Southbank Centre (Hayward Gallery) and Plymouth Museums (part of the consortium led by Royal Albert Memorial Museum) saw closures for renovation which significantly affected their attendance figures for 2016/17, while Artichoke’s attendance figures were affected by the timings of some of their regular events (specifically their Lumiere festivals) which means their audience numbers would be expected to fluctuate biennially… There may well be other examples of this, however these were the ones with the largest impact and stood out most significantly in our analysis.”
They continued: “The Southbank Centre reported the largest drop in total attendances across the whole portfolio, approximately 80% of which were exhibition attendances…”.
But the scale of the reported decline – equivalent to almost three times the total annual visitor numbers at the British Museum, Britain’s most popular visitor attraction – raises questions about this explanation.
The organisations cited by ACE had a combined overall audience of around 6 million for exhibitions in 2015/16, meaning that even if visits fell to zero in 2016/17, this would account for less than half of the 16.6 million drop in attendance claimed by ACE in its Annual Report.
Other explanation
The figures ACE has used in its analysis are drawn from data in the annual returns that all NPOs are required to complete.
AP has found that the majority of the total reported fall in attendance appears to be down to one London-based, medium-sized visual arts organisation which holds exhibitions attracting very large audiences. Such an organisation appears to have been included in ACE’s reported NPO visitor numbers in 2015/16, but not in 2016/17.
ACE declined to confirm AP’s analysis, and will not name the organisation thought to have been excluded, on the grounds that “this could potentially reveal commercially sensitive information.”
But its annual return data reveals that the only NPO in the UK with exhibition audiences on this scale is the London-based public art organisation UP Projects, which garnered around 14.5 million visitors for its exhibitions in 2015/16. Its visitor numbers are by far the highest of any NPO, because of the location of its displays in public places such as parks.
UP Projects’ founding director, Emma Underhill, told AP that the organisation had introduced a new and more accurate method for calculating audience numbers in 2015/16, following discussions with ACE. “We’ve had some dialogue with them about how we measure our audiences,” said Underhill.
But she confirmed that the same method for calculating audience numbers had been used for the organisation's annual return in 2016/17 as in 2015/16, and said that the attendance numbers “wouldn’t have been wildly different” across the two years.
“We submit one [survey] every year, we have to. But I’m not sure what they do with the data from there,” said Underhill.
Misleading figures
ACE has described the attendance and visitor figures given in its Annual Report as a “temporary drop”, though it is unclear how it can know that the reported decline will not be sustained.
Adding and removing organisations from its “constant sample” would, however, be able to influence the figures.
Following further questions by AP, an ACE spokesperson admitted that “ultimately the difference [between the two years] is to do with the inclusions in the constant sample, and the removal of outliers”, though no mention of this was made in its Annual Report.
They explained: “…the size and make-up of constant samples changes year on year.
“Changes in constant samples are typically based on availability of data, however we may remove outliers if we suspect they have been submitted in error and we [have] not received confirmation or explanation of variations. We may also remove extreme values which would artificially skew totals.”
ACE insists that the figures and explanations published in its 2017/18 Annual Report are not misleading.
Performance indicator
Sustained attendance and visitor numbers at NPOs and Major Partner Museums are critical to ACE, as they have for many years been among the Key Performance Indicators (KPIs) set out in its management agreement with the DCMS.
They are included among seven KPIs in ACE’s latest management agreement with DCMS, which runs from 2016-2020. These were approved in May this year, and a spokesperson explained “there are no numerical targets – the idea being that reporting against them will help to establish a baseline for future Management Agreements.”
Join the Discussion
You must be logged in to post a comment.